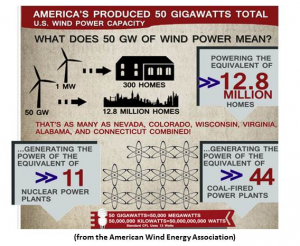
Currently, wind power is the most widespread and proven renewable energy electricity generation technology. While it has come a long way in the last decade, there is still much more to be done. The PTC (production tax credit), which is essential at this point for making many wind projects financially feasible, is due to expire at the end of the year. This article at Greentech does a good job describing the issue. The article also covers the benefits renewables can offer in terms of job creation, which by most measures, is quite significant (the source of their data notwithstanding).
However, as the headline indicates, the growth of installed capacity in the U.S. to 50 GW is the point. This statement, in and of itself, is rather innocuous. It is a more-or-less straightforward statement of fact. Crucially however, the infographic from AWEA offered up in the article really simplifies things. The graphic makes the assertion that 50 GW of installed wind capacity is equal to generation of 44 coal plants (or 11 nuclear plants). The actual output of coal plants can vary widely, however. There are details on graphics like this that are unnecessary, but when juxtapositioning wind and coal directly, the devil is in the details. How big are these hypothetical plants? Or, more exactly, what is their generation capacity? Is the estimate reasonable?
In 2009, coal plants in the U.S. generated at 64% efficiency. To wonks, this is the “capacity factor”. This metric describes the total generating capacity of a plant or fuel, versus what is actually generated. Nuclear historically has the highest capacity factor (about 90%), and factors for other fuels depend on the variables that affect that fuel. The capacity factor for hydro, for example, depends on precipitation and other variables. Capacity factor may be the most important variable in calculating the viability of new capacity construction (along with interest rates and the PTC), but it is uncommon to find it mentioned in news stories on the topic. You typically must go to specialty journals or websites for this information. See the table of capacity factors on page 48 of EIA’s 2009 Energy Annual here.
Wind is calculated to generate at about 48% in 2010, which has been improving steadily in the last decade. Wind capacity factors will be affected by average wind speed and the type of turbine, to name a couple of variables.
Back to the point…
Because the type of coal plant in the AWEA graphic is not stipulated, we must work on averages. The question is: Is the size estimate reasonable? How big are these hypothetical coal plants? 50 GW of installed capacity of coal at 44 plants works out to a per plant capacity of 1.14 GW. When considering coal’s average capacity factor for 2009 (2010, oddly, is not available at EIA as of now) of 64%, this works out to a rough total of 280,320,000 MWh of generation per year for these 44 hypothetical plants. Considering wind’s capacity factor (48%), 50 GW of capacity works out to (50 GW x 365 days x 24 hours)= 438,000 GWh (total generation capacity for one year) x .48 = 210,240 GWh, or 210,240,000 MWh. This number is significantly lower than 280,320,000.
Back to the per plant average. If we divide the 280,320,000 by 44, we get 6,370,909 MWh of annual generation per hypothetical coal plant. Now we simply divide wind’s hypothetical total generation (210,240,000 MWh) by the per plant average above (6,370,909 MWh), which comes out to just about 33 plants at the 1.14GW size. This was a rather long way ’round to the point that, given the information on the graphic, we don’t know what size coal plant AWEA is actually talking about and would just have to trust their math. More on this calculation below.
To figure out the size AWEA actually used, we would simply divide annual wind generation (210,240,000 MWh) by 44 plants. This works out to about 4,778,180 MWh generated per plant. Now, working backwards using this number and coal’s capacity factor, we know that (4,778,180 MWh / x) = .64. This means that “x” (total annual generating capacity) = 7,465,909 MWh. We must also now break this down and remove the temporal variable to get generating capacity. We do this by dividing (24 and 365) out of it, and get an 852 MW average plant generating capacity. This is a very reasonable estimate (though a bit off due to rounding).
Though this is a solid estimate, there are a couple of things about the graphic that might cause some misinterpretation.
1. As should be clear from the seemingly worthless calculations above, 50 GW of installed coal capacity will generate much more electricity than 50 GW of installed wind. It will just be much dirtier.
2. The capacity factor I used from 2009 to calculate coal generation was historically low. If you chose to do the calculations again using the capacity factor for 2008 (72%), you would find that AWEA’s estimate of 44 plants would be lower (it would actually be 39). Not a huge difference, but an important one to advocates. The devil sure is in the details..
Maybe plant size and capacity factors are extraneous details on an infographic like that, but hey, more transparency is always better than less.


